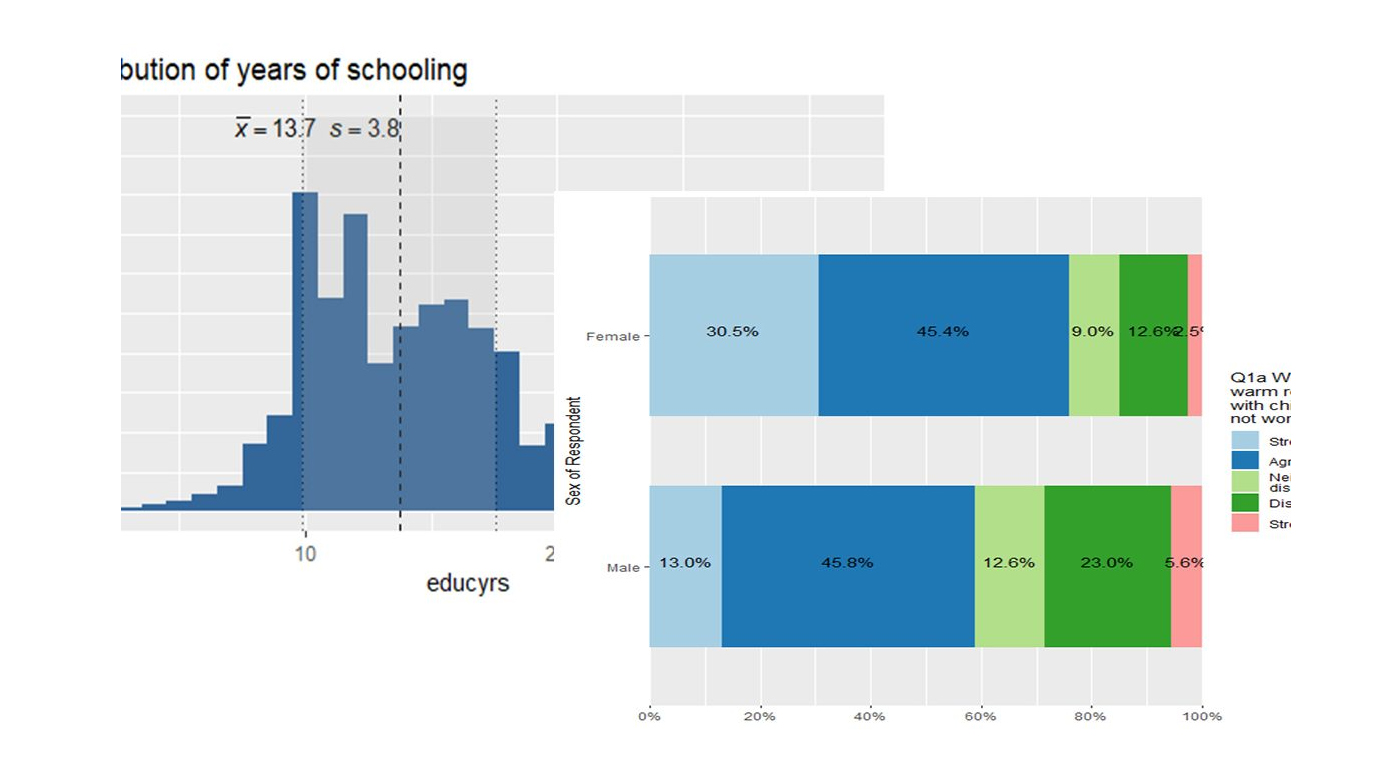
Grafik seperti pie chart, bar chart, atau tabel frekuensi sudah tersedia di perintah base bawaan R. Akan tetapi, tampilan yang kaku kadang membuatpengguna kurang puas. Apalagi grafik yang ditampilkan digunakan untuk hal yangmementingkan estetika seperti untuk presentasi.
Sebenarnyabanyak package yang tersedia untukmembuat grafik. Namun, kali ini saya akan membahas tentang SjPlot. Sebuah package sederhana yang mudah digunakan dalam pembuatan grafik.Secara singkat, berikut adalah tutorialnya :
[AdSense-A]
- Bar Graph
>sjp.frq(data$fechld, type = "bar", title = "Attitude toward working mom")
>sjp.frq(data$fechld, type = "bar", title = "Attitude toward working mom", show.prc = FALSE) # do not show percentages
>sjp.frq(data$fechld, type = "bar", title = "Attitude toward working mom", show.n = FALSE) # do not show frequencies

2. Stacked Bar Chart
>sjp.stackfrq(aus2012$fechld)
>sjp.stackfrq(aus2012[, c(“fechld”, “fepresch”, “famsuffr”, “homekid”, “housewrk”)], title = “Attitude toward working women (or mom)”) # plot many variables simultaneously
>sjp.stackfrq(aus2012[, c(“fechld”, “fepresch”, “famsuffr”, “homekid”, “housewrk”)], title = “Attitude toward working women (or mom)”, coord.flip = FALSE) # the x and y axis are swaped

3. Grouped Bar
>Chartsjp.xtab(aus2012$sex, aus2012$fechld, bar.pos = “stack”, show.total = FALSE, margin = “row”, coord.flip = TRUE, show.n = FALSE)

4. Box Plot
>sjp.frq(aus2012$age, type = “box”)

[AdSense-A]
5. Grouped Box Plot
>sjp.grpfrq(aus2012$age, aus2012$sex, type = “box”)

6. Histogram
>sjp.frq(aus2012$age, type = “hist”, title = “Distribution of Respondents’ Age”, show.mean=TRUE)

[AdSense-A]


Leave a Reply